
This article is the first of a new series of 5 articles about Innovation Waves. It introduces the topic with Innovation Waves Associated With Invention and Discovery.
Looking at innovation from a historical perspective reveals that the long series of innovative products generated by the industrial world have come in a progression of waves, with each wave originating from an invention or a discovery. The following are a few examples of inventions and discoveries that have changed drastically the world in which we live today:
- Liquid-crystal display (LCD) technology (including electro-optics), first a scientific discovery then the basis for products such as flat-panel LCD displays and LCD projectors
- Signal compression, first as mathematical algorithms then the basis for products such as music files (MP3), image files (JPEG), high-definition TV (HDTV)
- The Internet first as a means of global communication then the basis for products and services such as data mining, networking, online businesses
After its birth, an invention or discovery is known initially only within a small community. Gradually, applications are found. Eventually the spread of knowledge gains momentum, triggering many development initiatives. After a lag time which can vary widely depending on the technology, the invention or discovery deeply affects the industry sectors in which it can provide direct benefit. At that point, many innovation projects are taking place in a competitive atmosphere. The invention or discovery reaches its maximum penetration rate when the related patent filings peak. Penetration then continues, at a slower rate, as the invention or discovery spreads to adjacent industrial fields for which the benefit is more indirect.
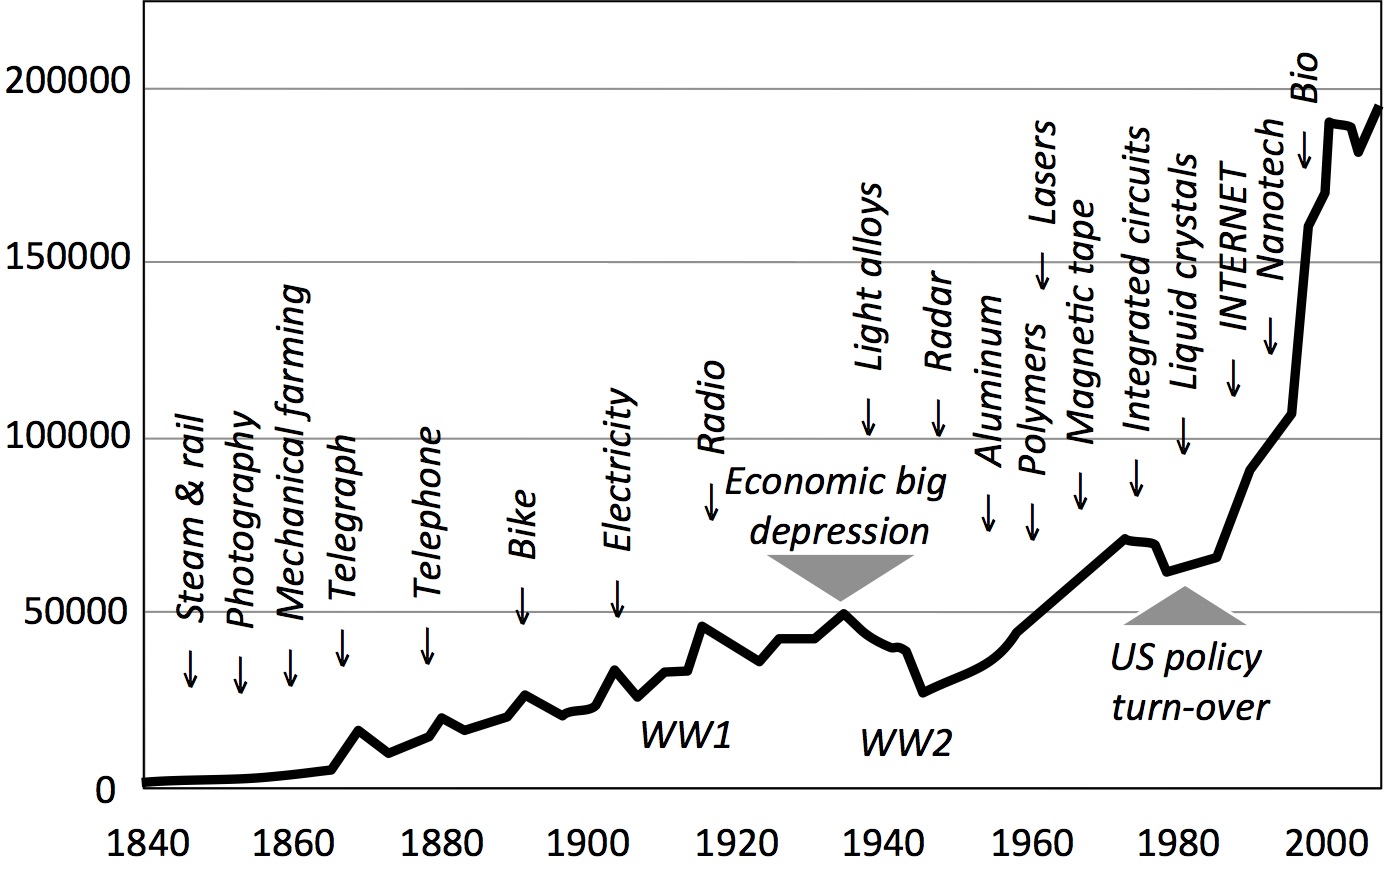
US patent rate. This chart shows the rate at which the U.S. Patent and Trademark Office has granted patents each year since its creation. Significant key events contributing to waves of innovation are indicated.
The figure on the right displays the rate at which the U.S. Patent and Trademark Office (USPTO) has granted patents each year since its creation in 1836. Note the sharp growth in the past thirty years and notice that World War I and World War II each had less effect on the patent rate than did the Great Depression or the drastic policy change in U.S. jurisprudence in 1982. In the figure we have also noted the approximate innovation wave peaks associated with several key inventions and discoveries. One of the champions of these was electricity, which experienced decades of lag time because its application had to wait for shops and homes to connect to the grid, which was a slow but impressive tsunami. Today’s digital wave seems to promise a similar reshaping of the economic landscape. In contrast to slow but massive waves, we have also experienced a rapid mini-wave associated with giant magnetoresistance. An explanation of the physical effect of giant magnetoresistance was first published in 1988. Its key application, thin-film heads for hard disks, was marketed by IBM in 1997—this period from 1988 to 1997 was probably one of the shortest lag times ever. Giant magnetoresistance is also now applied to some MEMS.

***
This article was initially published in the book Innovation Intelligence (2015). It is the fourth section of the third chapter.
From decision to action
The Conciergerie helps you engage on demand top level experts for industrial innovation